
01 Nov Making Use of Pivot Table Calculated Fields
Howdee! For the second part of my Excel pivot table series, I want to cover pivot table calculated fields. Calculated fields are super handy ways to customize your data in a pivot table. For example, if you have sales by state in a pivot table, with states as your rows, you’re going to be seeing the aggregate for all states. If the number is annualized, but 50% of sales came in December, you might want to call this out without adding months as a field to your pivot table. Using a pivot table calculated field, it’s easy to accomplish this since the calculated field will allow you specify criteria without needing to filter the entire table.
What do Pivot Table Calculated Fields Do?
In short, calculated fields allow you to perform calculations on data that is already aggregated. It’s important to make this distinction early. The individual amounts in the other fields are aggregated, and then your calculation is performed on that. It’s the difference between performing a calculation on every cell in a column and performing a calculation on the sum of that column. Also, the only function available to a calculated field is the sum of another field. So, you cannot perform calculated fields on the average of a field.
Creating a Basic Calculated Field
Creating a calculated field is surprisingly easy. For my data today, I’ve changed to some sample sales data for some stores in Canada. Let’s say that we provide our regional managers with a bonus equivalent to 3% of total sales in their region and our manager has asked us to prepare this schedule for review. To do this as a calculated field, click anywhere in the pivot table. Then click on the Analyze tab of PivotTable Tools. In the “Calculations” group, you’ll see “Fields, Items, & Sets”. Click this and then select Calculated Field.

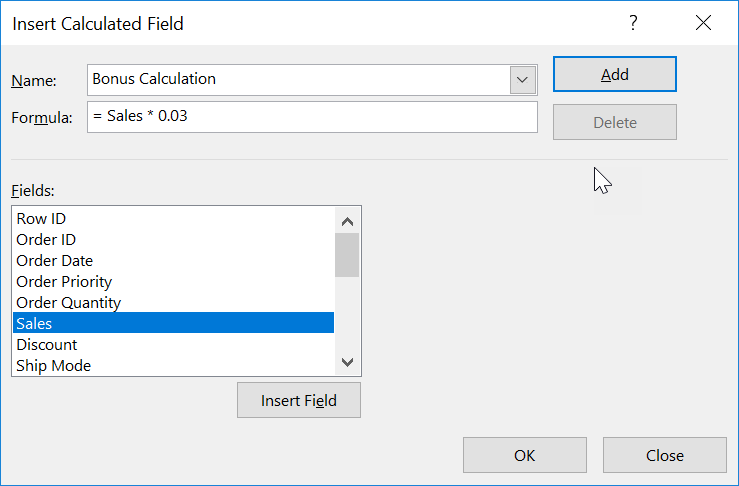
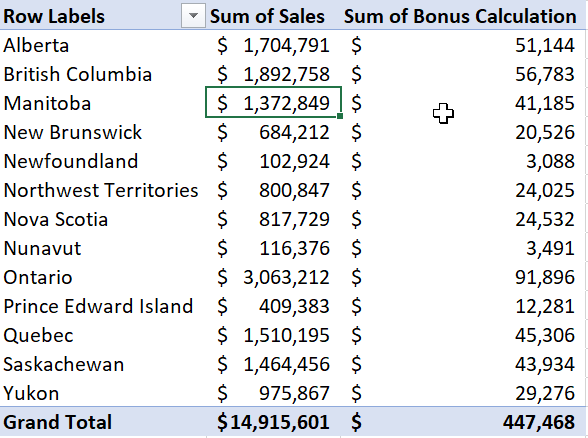
In the popup, you can name your calculation anything you wish. I’ll name this one Bonus Calculation so it’s clear. The next field is where you’ll build your expression. The available fields are below, and you can double click on them to insert them into the expression. To multiply the sum of sales by 3%, we just need to insert the sales field. Remember the field is already being summed so we don’t have to instruct it to do that. Once you’ve entered your expression, click Add and then OK. My calculated field looks like this:
It’s that simple and it uses a lot less data then performing this calculation on thousands of rows and then pulling it into the pivot table. Now, let’s get a little more complex.
Creating an Advanced Calculated Field
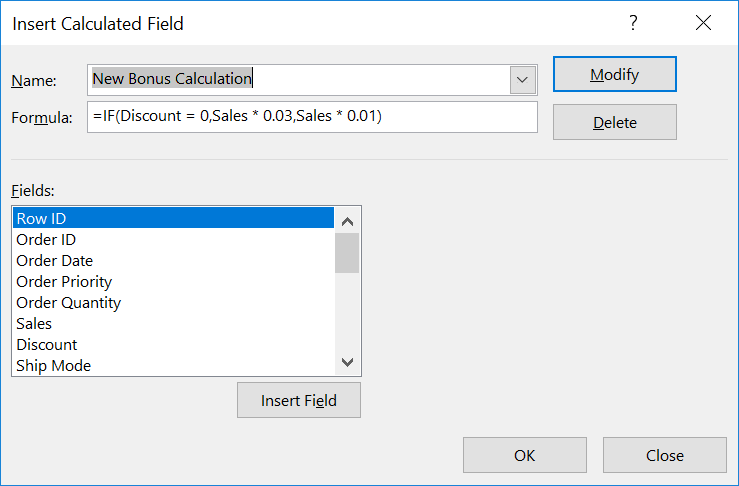
Keeping with our previous example, let’s say that the 3% bonus is only valid if the item was not discounted. If the item was discounted the bonus amount is only 1%. To me, this where learning about pivot table calculated fields really pays off. Adding this logic to each row of your data creates undo stress on the workbook calculation time. Performing this calculation in a calculated field is very similar to the formula you would use in the cell:
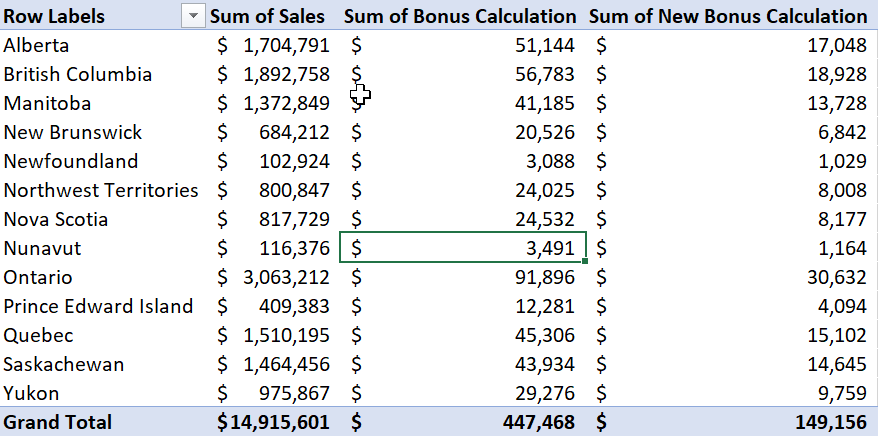
As you can see, the new bonus calculation is less than the previous which is what we would expect given the criteria. Now, whenever we refresh the pivot table data, these calculations will always be applied.
Pivot Table Calculated Field Issues
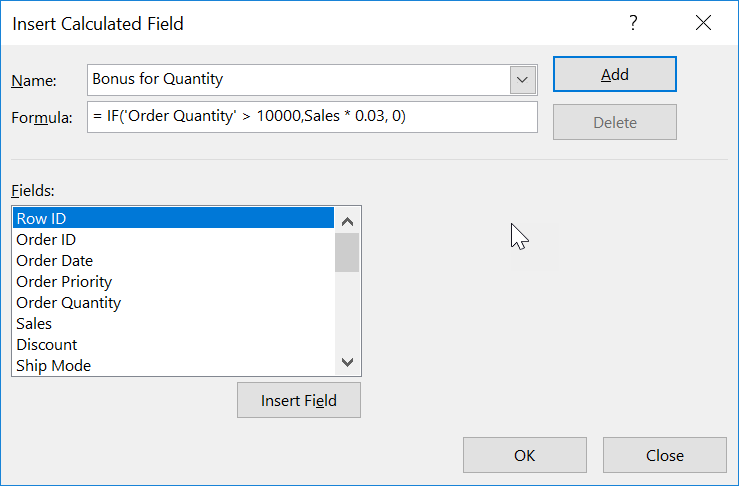
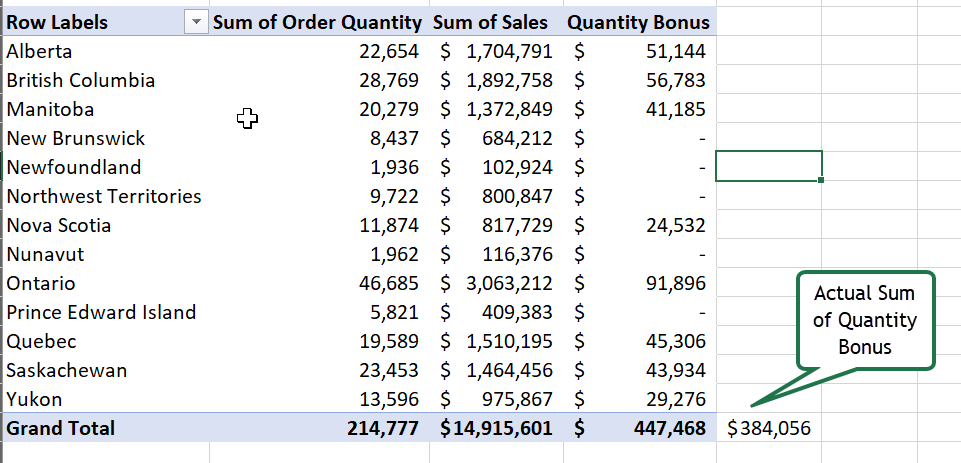
There are some issues to be on the lookout for when using calculated fields. While they are useful, they are not always appropriate depending on what you’re trying to accomplish. You probably would expect a grand total or subtotal for a calculated field to behave just like that, a total. However, the subtotal and total rows will evaluate the expression as well. Let’s say the bonus is in effect if a particular region sells more than 10,000 units. A calculated field for this would look like:
This is important to think about when using calculated columns. If expression criteria will be met by sub totals and totals but not by the smallest grouping in your table, the results will be misleading if you aren’t aware what you’re looking at. An easy workaround for this is to turn off the sub totals or totals for your pivot table and, if they’re important to the report, include them as sum formulas instead of part of the pivot table. You can format like the pivot table and most people won’t know the difference.
Calculated Field Summary
At the end of the day, calculated fields are a tool that is available within the pivot table tool box. They aren’t appropriate for every situation, but can add a nice touch to reports where they are appropriate. My general rule of thumb for using this is to ask myself these two questions:
- Will I need to perform an additional calculation on this calculated field?
- Will all my subtotals and grand totals display correctly if I use a calculated field?
If I answer No and Yes respectively, then I go ahead and use a calculated field. If not, I create a new column in my dataset to house the calculation. This is not a rule you must follow, but it has served me well thus far.
As always, my example file is available for you in the Example Files section of the site. You just need to sign up for a free membership to get access. It is very easy, and I don’t spam anyone with unnecessary emails.
Lastly, if you have question about anything covered above or other pivot table topics, please drop them in the comments below. Until next time…
Cheers,
R


No Comments